Who's On First globes

I've start making globes. Just little ones to begin, only six inches in diameter, and I am not worrying too much about making them pretty or elegant yet. I wanted to see whether I could do it at all. What follows are the steps and instructions I cobbled together, from different corners of the internet, to make a printed globe using open data and open source software.
Getting started
There's no way around the fact that making map gores requires installing a backyard swimming pool's worth of dependencies. The good news is that everything is available in one or more of the many "package managers" out there. If you haven't already run away in fear at the mention of the phrase "package manager" there is an equal amount of technical jargon you'll need to weather to get anything done.
As far as dependencies go everything that follows could be wrapped up in a container format like Docker which would reduce the number of steps from "many" to "download a single 500MB application with risky-to-dubious permissions requirements but has a cute desktop icon you can click on". One step at a time.
Data (Who's On First)
There is nothing Who's On First (WOF) specific about these globes. Any data source will do assuming you can wrangle it in to a spatial database or format. Since I spend a lot of time working on WOF I thought it would be good to see whether I could actually make something with all that data. It's been a good way to spot outstanding issues in WOF.
wof-shapefile-index
The first step is to take WOF data and convert it in to (ESRI) shapefiles. Shapefiles are not the only option. They were just easy. I am using the Mapnik rendering engine to draw the map and it can be configured to work with a variety of data sources. Support for shapefiles is enabled by default in Mapnik and doesn't require setting up a standalone database so laziness won the day. I have also been working on tools to create shapefiles from raw WOF data so this was a good way to test them out.

In order to use the go-whosonfirst-shapefile tools you will need to have the
Go programming language installed. You will also need to
install the git, make and gcc tools. All four are available in most
package managers but I prefer to install Go from source since the package
managers are typically out of date by a few releases.
The first step is to download and compile the go-whosonfirst-shapefile package:
git clone https://github.com/whosonfirst/go-whosonfirst-shapefile.git
cd go-whosonfirst-shapefile
make bin
Once that's done so I can create shapefiles from WOF data using the
wof-shapefile-index tool like this:
$> ./bin/wof-shapefile-index -out wof.shp -shapetype POLYGON -mode meta \
wof-continent-latest.csv \
wof-country-latest.csv \
wof-region-latest.csv
What's going on here? I am asking the wof-shapefile-index tool to create a
shapefile called wof.shp with all the data found in one or more WOF "meta"
files. Meta files are just CSV files with a specific subset of WOF records, in
this case continents and countries and regions. Again this was just for the sake
of expediency.
The core whosonfirst-data set has gotten quite big (like 4.8M records of
which about two million are localities) so plowing through all those extra
records didn't seem worth it. I also happened to have pre-generated the meta
files. Meta files are not included with WOF data but there is a handy tool for
generating them included with every data repo. For example:
$> git clone https://github.com/whosonfirst-data/whosonfirst-data.git
...time passes
...time keeps passing
...time keeps on slipping slipping slipping in to the future
$> cd whosonfirst-data
$> make metafiles
...more time passes
$> ls -la metafiles
metafiles/wof-continent-latest.csv
...and so on
None of this happens quickly. The whosonfirst-data repository is already
very very large (it's huge in a too-too-big kind of way, really) and has an even
larger Git history file so everything takes a while just to download. Just
generating the meta files takes 10-15 minutes on a modern laptop. The
world is a big place.

A better alternative for most people is to download the WOF SQLite distributions
that are created (usually nightly) from the most recent data in the
whosonfirst-data
repositories. You'll also need to make sure you've installed the bunzip2 utility to uncompress
the data (that's what the -j flag in the command
below is for).
$> wget https://dist.whosonfirst.org/sqlite/whosonfirst-data-latest.db.tar.bz2
$> tar -xjf whosonfirst-data-latest.db.tar.bz2
Now it's possible to generate a new shapefile from the data in the SQLite database,
passing the -mode sqlite and multiple -include-placetype flags to the
wof-shapefile-index tool. Like this:
$> wof-shapefile-index -out wof.shp -shapetype POLYGON -mode sqlite \
-include-placetype continent \
-include-placetype country \
-include-placetype region \
whosonfirst-data-latest.db
Note: For the sake of brevity all of these examples assume relative paths so you will need to adjust things according to where they are found on your computer.
Maps

Mapnik and nik2img.py (and pip)
I am using Dane Springmeyer's handy nik2img.py tool to render the shapefile as an image. Dane's tool depends on Mapnik, and specifically the Mapnik Python bindings.
On a Mac with the Homebrew package manager installed it's pretty straighforward. You'd just type:
$> brew install mapnik
On a Linux machine you would type:
$> apt-get install python-mapnik pip
apt-get is the package manager that comes with Ubuntu. If you're using a
RedHat variant you would replace apt-get with yum. I am not sure what you do
on a Windows machine but as I write this Homebrew is now available for both
Windows and Linux operating systems so maybe that is the easiest thing these day?

Did you notice the way I am also installing something called pip in the Linux
example? pip is itself a package manager for Python libraries. On a
Mac you might need to install it by installing the Homebrew version of Python
itself but I am hesitant to suggest anything involving Python on a Mac since
there are so many ways to mess things up because everyone's Python installation is
a special snowflake. It's all do-able, it's just a different
set of steps for each person.
In the end you want to be able to run the following command:
$> pip install nik2img
Which will install a command line tool called
nik2img.py on your computer, which can be run like this:
$> nik2img.py map.xml map.png --bbox -180 -90 180 90 --dimensions 3600 1800
Above, I am asking nik2img.py to create a new image called map.png depicting
the entire world and whose dimensions are 3600 x 1800 pixels, or 12 inches by 6 inches
at 300 dot per inch. I am also telling nik2img.py to look for all its data and styling
configurations in a file called map.xml. I am not going to get in to the details of
Mapnik style definitions here since they
are well documented elsewhere. Here's what the Mapnik style
document I used to create my first globe looks like:
<Map background-color="#D5F4F8" srs="+proj=longlat +ellps=WGS84 +datum=WGS84 +no_defs">
    <Style name="WOF">
        <Rule>
            <PolygonSymbolizer fill="#f4ef74"/>
            <LineSymbolizer stroke="#f11499" stroke-width="1" />
        </Rule>
    </Style>
    <Layer name="vector" srs="+proj=longlat +ellps=WGS84 +datum=WGS84 +no_defs">
        <StyleName>WOF</StyleName>
        <Datasource>
            <Parameter name="type">shape</Parameter>
            <Parameter name="file">wof.shp</Parameter>
        </Datasource>
    </Layer>
</Map>
See all the srs="+proj=..." stuff? This
tells Mapnik that I want to create a map
using the WSG84 projection, sometimes
called EPSG:4326. Discussions of map projections are a
bit of a black hole
but if you're curious to learn more Lyzi Diamond's EPSG 4326 vs EPSG 3857 (projections, datums,
coordinate systems, and more!) is a good place to start. The
point is to create a map using a Simple Cylindrical projection.
gdal_translate
The next step is to convert the PNG image in to a geo-referenced TIFF (or
GeoTIFF) file emebedding the extent of the map (the whole world) and the map
projection we're using (WSG84). This is done using the gdal_translate utility which is installed as part of the
larger GDAL toolchain which is used
by Mapnik so it should already be installed. Note the -a_srs EPSG:4236 flag. That's just another way of saying This is using
the
WGS84 projection.
$> gdal_translate -of Gtiff -a_ullr -180 -90 180 90 -a_srs EPSG:4236 map.png map.tiff
Globes
gdal2gores.py
I use Trent Hare's gdal2gores.py utility to convert the rectangular map in to a series of map "gores". In other words we take a rectangular map and turn it in to a bunch of equal-width "orange peels". Hare writes:
Given a Simple Cylindrical map projected image remap to an image with n gores for placing map or printing map on a sphere (e.g. tennis ball). I'm sure this could be optimized!
gdal2gores.py depends on the Python bindings for GDAL to be installed. I'm a little
hazy about which package manager installs which Python bindings for which
low-level libraries. On a Linux machine you may need to apt-get install
python-gdal in order for this to work.
$> gdal2gores.py -ng 16 ./map.tiff ./map-gores.jpg
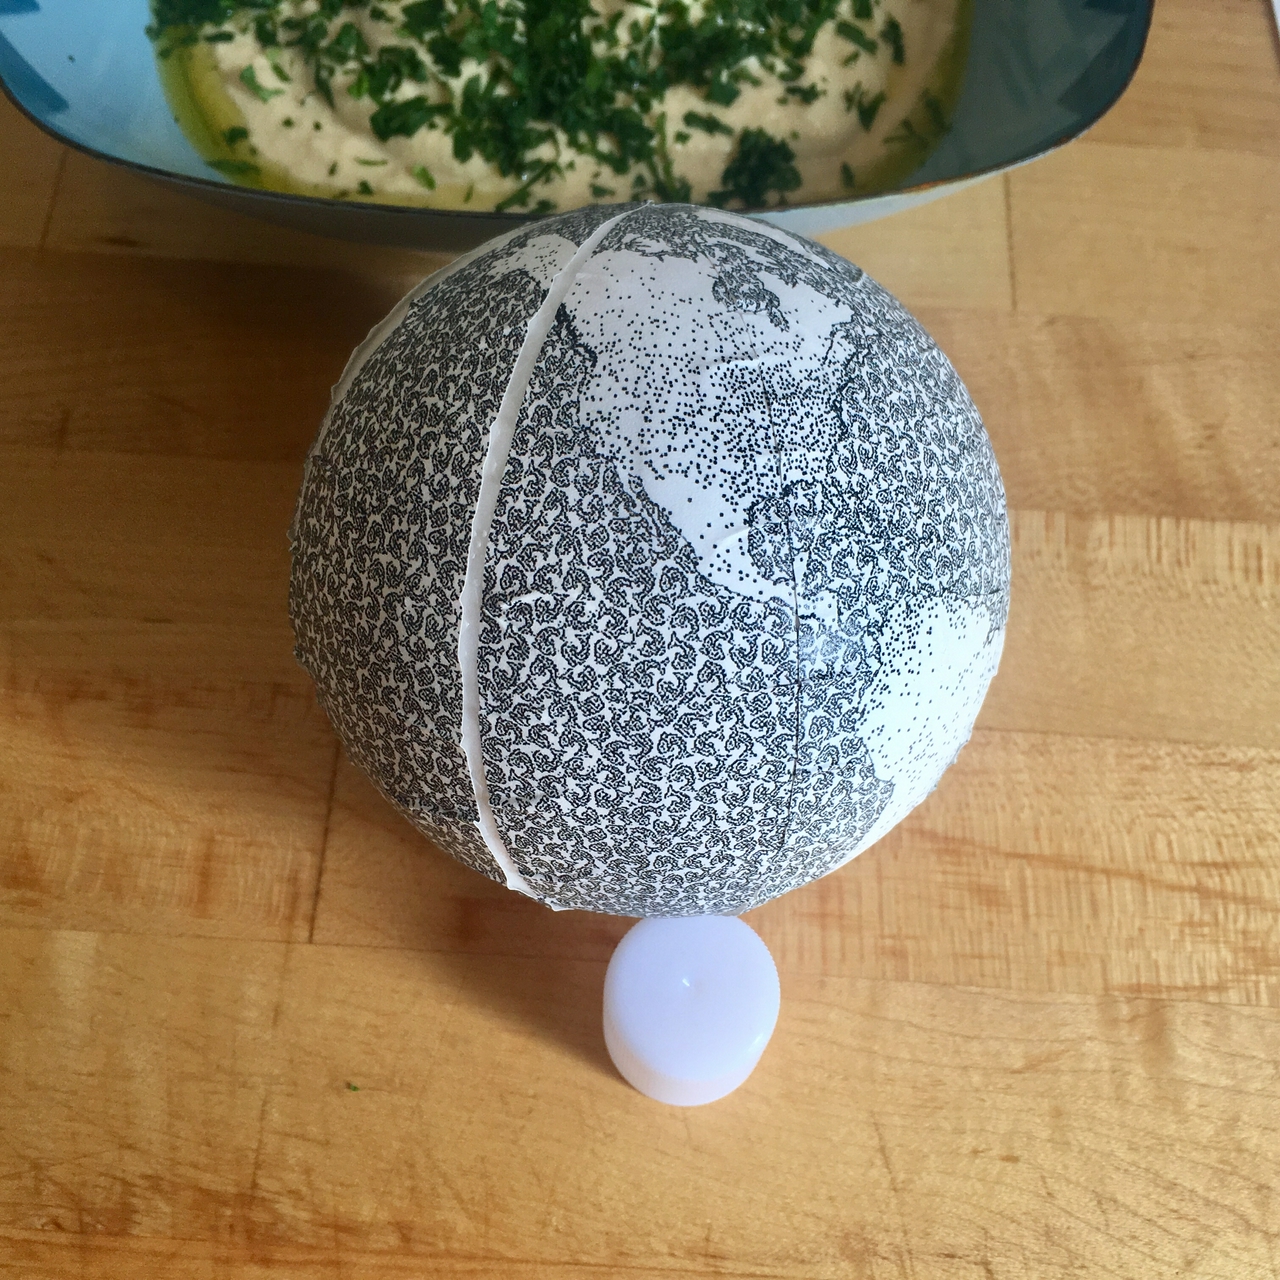
And then, finally, I have 16 distinct map gores that I can print and cut out and glue to a sphere. I've been going to the local fabric store and buying cheap foam balls to work with. Anything larger than 6 to 8 inches starts to get more expensive than you think it should so I might investigate papier-mâché-ed balloons, notwithstanding the challenge of inflating a perfect sphere.
Here's what I've learned so far:
- 32 or more gores are best for a 6" globe. 16 gores are okay but not great and 8 gores don't work at all. Because of the way you have to pinch the paper to fit the sphere you end up with gaps in the final globe.
gdal2gores.pydoesn't draw outlines around the map gores. If you've styled your land cover to be white and you're printing them on white paper it can be hard to see where to cut the gores around the poles. I might try patching the code to draw the gores on a textured background to make it easier to cut things out.- It's very easy to mess up the poles when gluing map gores to a globe. Sorry, Antarctica.
- Glue sticks are awesome.
At some point, I would like to investigate marrying Peter Richarson's work to support different (non-web-map) projections in the Tangram rendering engine with the LA Times' Web Map Maker tool used to generate static images of maps rendered with Tangram. (As I write this most of the inline maps in Peter's blog post are broken but they work if you follow the links.) In the meantime I've been keeping notes and examples and tools in a whosonfirst-globe repo on GitHub. Suggestions and improvements, particularly around setting up dependencies for all the different operating systems, would be welcome.
Globes!
This blog post is full of links.
#globes