
Stating the obvious one post at a time
Meanwhile, in the So obvious it hurts
Department :
Timelines for weblog
archives. This is still very much a work in progress but
gradually I will add them across the board.
Update: I've started experimenting with grouping posts by date but labeling them by tag. It gives a better sense of the shape of things and makes it easier to handle years with (too) many posts. It is also a good tool for spotting posts that are poorly tagged or not tagged at all.

There are a lot of design-y / layout issues that still need to be accounted for, particularly labels that are too long to be displayed properly. There may be ways to tweak things in the JavaScript code but I haven't poked at it too much yet. I was a little terrified to find so much of the CSS inlined but maybe there's a reason for that. We'll see.
Related : a timeline of my Flickr photos from January, 2006.
This blog post is full of links.
#timelineupcalendar
I think the first thing I ever seriously considered writing in Series 60 Python was an application to talk to Upcoming.
Last winter, I decided to go a Dorkbot meeting for the
first time. As is my fashion I didn't bother to write down
the directions, instead quickly looking at the address before I
left the office and making a ballpark mental map of the
location. By the time I'd gotten there
I had
forgotten most of the details and found myself walking
straight in to the heart of the Tenderloin.
The Tenderloin doesn't really bother me, at least not in the way it is talked about it in hushed tones, but I knew it wasn't where I was supposed to be going. I also didn't feel like it was the best place to whip out a laptop and start poking around for wireless hot-spots. I wouldn't have thought twice about getting out my phone, though. In fact, I employed cutting edge mashup technology to call a friend who I knew would be sitting in front of the Interweb and got him to tell me the address.
But really : It's a no-brainer. Why not just sync events in Upcoming with the calendar on my phone? Store the name of the event, an address and phone number and optionally an alarm so that I'm not caught by surprise. That's it. Which isn't much. Until the moment when you need that information — and not, say, your social network's tags for that event — at which point it's eveything.
 upcalendar (0.1) says hello!
 ----------------------------------
 Reading configs
 Testing network connection
 Testing authentication token
 ----------------------------------
 Welcome, straup - upcalendar is ready to go!
 To begin, select 'Merge your watchlist' from the Options menu
 Collecting events on your watchlist
 Found 13 events

 #
 # At this point, the application actually starts to store
 # the events in your calendar. When run in debug (emulation)
 # mode on the desktop it dumps event data to the screen.
 #

 Ozomatli
 Stern Grove, 19th Ave & Sloat Blvd. (San Francisco) / 415.252.6252
 1156104000 - 1156104000

 Snakes on a mother-f***ing plane
 TBD, check the website (San Francisco)
 1155931200 - 1155931200

 Imaging Environment: Maps, Models, and Metaphors
 Stanford University, Stanford Campus (Palo Alto)
 1163095200 - 1163206800

 Presidential Lecture "Thinking About Blasphemy and Secular Criticism" by Talal Asad
 Stanford School of Education - Cubberley Auditorium, 485 Lasuen Mall (Stanford)
 1160449200 - 1160449200

 # And so on...

 Done!
Some notes:
- The calendar really needs to have
phone
andURL
details, complete with automagic content handlers for doing the Right Thing when you select them. - It's a Series 60 Python script. Speaking of which : threading in Series 60 Python — what an awesome idea. I wish it worked.
- I could be convinced to add glue to squirt individual venues in to the address book if people thought that would be useful.
- upcalendar uses Upcoming authentication tokens. The really short version is : Setting it up pretty much sucks on a mobile phone. Be sure to read the section on authentication in the README file. There are no magic bullets but you should only have to set it up once and is worth it in the end.
- Recurrence. So, no — not really. It's a hard problem and not one that occurs in Upcoming very often. I will tweak it on a case-by-case basis or as patches arrive.
- Please for similar device specific (or at a minimum, calendar and address book) integration in PyMaemo. Would that I were a C programmer.
Information wants to be fre... in your pocket : upcalendar.
This blog post is full of links.
#upcalendarWe are all watching each other
I saw Eric Paulos speak at Dorkbot, last week. Like a lot of people, these days, he is thinking about what networked computers all over the place will mean for urban spaces and the people living in them. He demo-ed something called Sashay which is a little application that logs all of the cell towers you pass during the day and then generates images mapping not their location but their relationship to each other.
He had already won me over when he talked about doing something more interesting than another application to find the closest restaurant and I thought : I should build one of those too. So I did.
# I have a lot of time to kill on the shuttle between
# the city and the Valley.

1154620721;gsm;310;170;240;20291
1154620655;bt;00:0e:ed:19:2a:64;00:13:70:6a:f7:b2; \
   00:13:70:6c:27:ce;00:16:db:da:0e:ca
1154620721;bt;00:13:70:6c:27:ce;00:0e:ed:19:2a:64; \
   00:13:70:6a:f7:b2;00:16:db:da:0e:ca
1154620787;gsm;310;170;240;20291
1154620787;bt;00:0e:ed:19:2a:64;00:13:70:6a:f7:b2; \
   00:13:70:6c:27:ce
1154620855;gsm;310;170;240;20291
1154620921;gsm;310;170;240;20291
1154620855;bt;00:0e:ed:19:2a:64;00:13:70:6a:f7:b2; \
   00:13:70:6c:27:ce;00:13:70:6d:24:55;00:07:e0:07:9a:a7; \
   00:16:20:84:17:5b
1154620921;bt;00:13:70:6c:27:ce;00:0e:ed:19:2a:64; \
   00:13:70:6a:f7:b2;00:13:70:6d:24:55;00:07:e0:07:9a:a7; \
   00:07:e0:22:b7:69;00:14:51:d4:a5:af;00:14:51:d6:06:bb
1154620988;gsm;310;170;240;20291
1154621058;gsm;310;170;240;20292
1154620988;bt;00:13:70:6c:27:ce;00:0e:ed:19:2a:64; \
   00:13:70:6a:f7:b2;00:13:70:6d:24:55;00:07:e0:07:9a:a7; \
   00:14:51:d4:a5:af;00:07:e0:22:b7:69;00:14:51:d6:06:bb
1154621058;bt;00:13:70:6a:f7:b2;00:13:70:6d:24:55; \
   00:07:e0:07:9a:a7;00:14:51:d4:a5:af;00:07:e0:22:b7:69; \
   00:14:51:d6:06:bb;00:13:70:6c:27:ce;00:0e:ed:19:2a:64
Exciting, huh? Most data collection isn't. What you're looking at is a Unix timestamp followed by a data source and either the available cell tower information (gsm) or the list of Bluetooth addresses within range (bt). Here's another way to look at it :
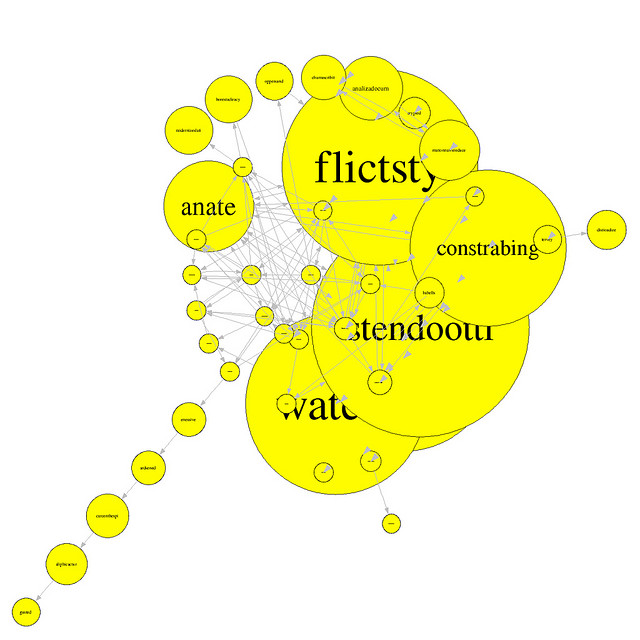
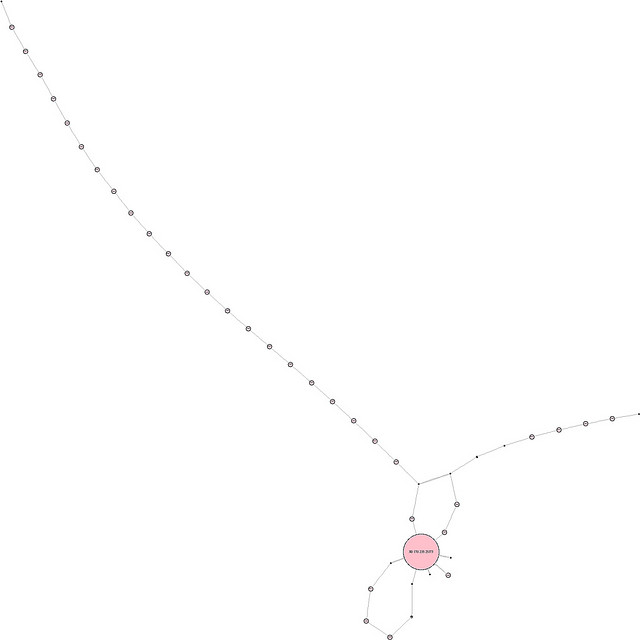
On the left are all the Bluetooth devices that I was
nearby during the day, and their nearby-ness to each
other. On the right, cell towers. These are not nearly as
sexy as the graphs that Paulos showed but you get the
idea. The GSM diagram is especially interesting to me since
it received no more special magic than anything Graphviz does and is a
more than better representation mapping
my day :
I started in the Mission and went down the 101 to Santa
Clara, and then further South for lunch looping back to the
office and then finally up and over to the mothership, in
Sunnyvale.
I wonder whether that was just a fluke or if it will
always be possible to recognize the shape of the
relationships. Speaking of relationships, the other other
fun bit would be to write a small app to scan the room for
available Bluetooth addresses and then associate known
devices with individuals in your address book. The when you
were crunching your Bluetooth logs you could cross-reference
the (device) addresses and display meaningful names
instead of Zorgon
or Pam's N72
. Or, if you
did that and also merged
their Flickr account data (with your address book) you could : Walk in to a room, scan it for all the Bluetooth addresses with corresponding Flickr IDs, fetch each users tags and...uh...
Profit!
s60-nwtracker.py is a Series 60 Python application to monitor and record nearby cell tower and bluetooth address information. The data can be stored locally to disk or to a network location over HTTP. It is only a tool for collecting data but since there aren't a whole lot of those out there I thought I would share mine.
Aside from the regular Series 60 Python, you'll also need the socket libraries from the nice PDIS people. The application can run happily in the background for many hours and probably all day if left uninterrupted. The nature of mobile phone operating systems may mean that another application running at the same time, or gobbling up all the available memory, will cause Python to be terminated without warning. Life sucks and so on.
Update : I've released a new version of the application that modifies the log string to include the interval, in seconds, between polling. Because mobile phone connections can be flakey, and because Series 60 Python will sometimes just silently die, this helps when generating reports and graph-y bits and determining whether two events were contiguous.
Be seeing you.
This blog post is full of links.
#watching